

Determining FMeXtra Injection

[May 2011] Modern modulation, especially digital modulation, has in some ways outrun the capabilities of the traditional modulation monitors. This is especially true in the case of high speed digital subcarriers. How can a station utilize digital subcarriers and yet have confidence in meeting FCC requirements? Lyle Henry shows the way.
Getting the highest possible injection on the subcarriers without affecting the main channel audio has always required careful adjustments. What follows is information on how to measure the digital subcarriers, along with total modulation, when using FMeXtra subcarrier generators.
We will use the the Belar FMMA-1 “The Wizard” and the Belar SCMA-1 SCA monitor for this discussion. The Wizard is used to observe total modulation since it has peak weighting capability. This is essential when running digital SCAs and will be explained below.
Setup
We will start by connecting the composite inputs of the SCMA-1 SCA monitor and The Wizard to the composite output of a modulation monitor or other accurate demodulator that is flat to 100 kHz. Alternatively, connect The Wizard to the IF output of an appropriate RF front end such as the Belar FMM-2, RFA-4, or DC-4 and connect the SCA monitor to The Wizard’s composite output.
Note: If you are running IBOC (HD Radio) or another adjacent channel digital signal, turn it off, or obtain the RF input from only the analog transmission path. These monitors are wideband and not designed to ignore significant energy above 100 kHz.
Setting up these monitors may require a review of The Wizard and SCMA-1 manuals as the operation of the four buttons is not too obvious. Proper saving is especially important, or you will not have the parameters you selected after any changes or power cycling. If you need a manual, they are available on the Belar site. Here are direct links to manuals for The Wizard and for the SCMA-1.
Setup for SCA Injection
There are two ways to use the SCMA-1 to measure injection:
(1) It can easily be done with no other modulation on the FM carrier (no audio, no pilot, no 2 RDS, no other SCAs) by using the SCA monitor with its bandpass filter “OUT.” It will then see the entire FMeXtra signal. See the SCMA-1 manual for the correct filter and SCA frequency setting.
(2) It can also be done in the presence of whatever else is on the air with the bandpass filter “IN.” This is the usual way that pilot, RDS, and SCA injection are measured. It is convenient, and can give accurate results
The SCMA-1 has a variable filter with a maximum bandwidth of 16 kHz, a good tool for working with FMeXtra, which offers a variety of setup choices and bandwidths.
When FMeXtra or other digital SCA signal is wider than 16 kHz, the SCMA-1 will read low when its filter is IN. But you can still read FMeXtra injection accurately with the following correction chart.
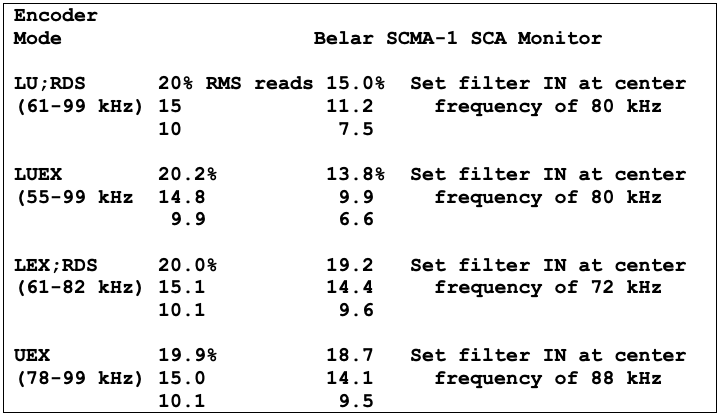
This correction chart applies to several typical FMeXtra modes and injection levels. The RMS and Indicated values are linear so you can interpolate as necessary.
Either way, be sure you are getting a very clean signal into your main channel modulation monitor/tuner. The ideal sample is from a Forward Power sample port on the transmission line or an RF sample port on the exciter.
Procedure
Set the SCMA-1 to its widest (16 kHz) bandwidth and the SCA frequency to the center of the FMeXtra signal so the monitor’s filter passband sees only that.
Choose the FM (RMS) mode for the detector, and check that the SCMA-1 is properly calibrated against the main channel monitor so both read the same when in TOTAL mode. The main channel monitor will probably have a calibration mode built in which can be used for this purpose as well as to check itself.
Now connect the FMeXtra signal to the SCA input of your exciter. Ignore the SCA modulation percentage on the SCMA-1 which will max out at 151%, but means nothing since the digital signal appears as noise.
If you are using a composite STL, connect the FMeXtra encoder to the MUX input on the STL transmitter and be sure the STL receiver will pass a 92 kHz SCA if you are going to run FMeXtra up that high in frequency. Many have a roll-off filter at 80 to 85 kHz if not ordered with the 92 kHz option. (As an example, the Moseley PCL-6000 series receivers can easily be broadened in the field by removing jumper E9 on the main board. Where there is a choice for other jumpers, they should be set to COMPOSITE.)
Do not connect the MUX port on the STL receiver to the exciter. This is an unfiltered output typically used to feed control subcarriers in the 150 to 185 kHz range to remote control gear. You do not want any signals or noise above 100 kHz going out over the air. If it does, your IBOC, your neighbors on the dial, and the government regulators will probably not be happy.
More Info For the Curious
Before I get into more details, let us take a quick look at what a high speed digital SCA may look like.
What I have here are spectrum analyzer photos of the 0 to 110 kHz baseband and of the RF signal coming out of the transmitter during tests at KWGS, Tulsa. I caught these at a pause in modulation so that the SCA frequencies in the RF photo would stand out.
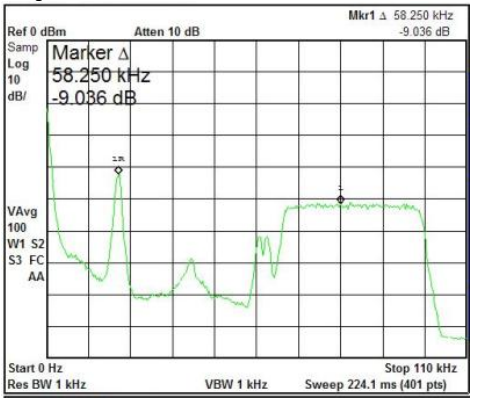
The baseband photo shows the L+R audio to about 15 kHz, the pilot at 19 kHz, the L-R audio from 23-53 kHz, RDS at 57 kHz, and FMeXtra operating in LU;RDS mode from 61 to 99 kHz at 20% injection
So why does FMeXtra appear so much lower than the 9% pilot if it is so much hotter? That is because it is spread out. The wider a digital signal is, the lower the flat top appears to be. Collapse it to a carrier and it would be 7 dB taller than the pilot.
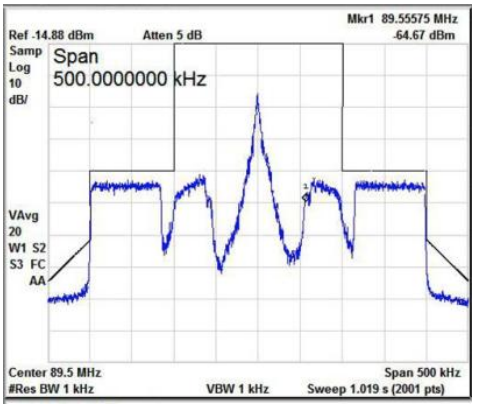
The RF output photo above shows the symmetrical distribution of the total modulation that is centered at 89.5 MHz, plus the MP3 mode IBOC signal at -20 dBc. RDS is also visible at the inside edge of FMeXtra.
OK then, why does the top of the FMeXtra signal slope downward when we can see that it is perfectly flat in the baseband photo? That is a very graphic portrayal of the effect of the FM modulation index, something you probably will not see unless you are running a swept audio signal into the exciter.
The higher the modulating frequency, the lower the sidebands appear. That is a reason why FM stereo is 20, or more, dB more noisy than mono and why higher frequency SCAs do not go as far at the same injection as lower frequency SCAs.
But all this is a subject for another time.
Understanding the RMs
Mark Grant is the design guy at Belar. I asked him if the SCMA-1 could be used to determine the RMS injection of digital signals.
He explained that it is the same as reading an analog SCA since the SCMA-1’s detector reads RMS when set to the FM mode. This is very convenient, but one must keep in mind that the digital signal may be wider than the monitor’s bandwidth as already mentioned. If so, then correction is needed as the chart above shows.
Explaining the Chart
In the examples shown in the chart above, I used the same FMeXtra encoder (g= setting) for each of the three injection levels: g= 0.5 for 20%, 0.36 for 15%, and 0.24 for 10%. The RMS power appears to be only slightly different at the various bandwidths.
To derive the indicated injections, the encoder was connected directly into the SCMA-1 SCA monitor and the FMMA-1 Wizard.
The SCA monitor’s filter was first switched out so the entire digital signal could be seen and the injection set; then the filter was switched in and the lower indicated injection noted. You can check your gear this way if you want to verify my numbers. I have checked several systems and they all agree. You can also make your own chart, perhaps for other bandwidths, or for digital signals other than FMeXtra.
Peak Modulation
Digital signals tend to have a high peak to RMS ratio, often called the crest factor. However, these peaks are narrow and contain little power.
On the other hand, The Wizard (without weighting) and the Total Modulation setting of the SCA monitor, as well as the STL and exciter modulation meters, will typically read much higher than the RMS power of the SCA since these indicators are usually very fast and catch those wispy little peaks. With FMeXtra at 20% injection, you may see unweighted total modulation hitting 140 to 150% with normal programming. With peak weighting, the reading will be much lower.
Back when the U.S. Federal Communications Commission (FCC) had Rules for modulation monitors, they defined a peak as 10 cycles of a 10 kHz sine wave. This is one millisecond. It also appeared that one could have up to five quick peaks within five milliseconds. Hence the use of the term “cycles” when setting weighting.
Finding the Right Level
Set the Wizard for 9 to 45 cycle peak weighting. Use the table above and the SCMA-1 to set the FMeXtra injection to the level desired.
Even at 20% RMS FMeXtra injection, you will probably find that total modulation does not exceed 110% on peaks of frequent recurrence, especially at 45 cycle weighting. This assumes that the total modulation was tightly controlled at 100% before adding FMeXtra (or some other high-speed digital subcarrier) and that stereo is being transmitted. Peak weighting does not appear to make as much difference on a mono station.
Why 110%? The FCC Rules permit increasing total modulation by one-half of the SCA injecttion up to a total of 110%.
With analog SCAs it has been common to turn down the main channel audio, though even this is less necessary when using peak weighting. The maximum SCA injection for stereo stations is 20%; for mono, it is 30%; however, above 75 kHz the limit is 10%. (The Rules may be somewhat different in other countries.)
The reason peak weighting works so well is that the more frequencies that make up the total modulation (L+R, Pilot, L-R, RDS, SCAs), the narrower are the created peaks which can then be ignored by the weighting. If you check the effect of weighting on the FMeXtra signal only, you will see less reduction. The following table is an example:
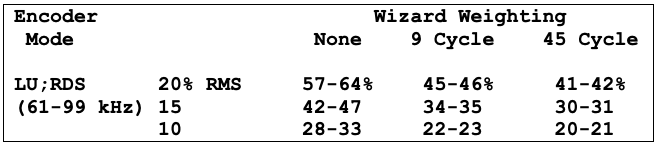
From this it is obvious that the FMeXtra peaks are about three times as high as the RMS, but that weighting reduces them. And as mentioned above, with normal programming the addition of a high speed digital SCA has much less effect when weighting is used.
Other Modulation Monitors
The Modulation Sciences ModMinder also employs peak weighting – and can be modified for various amounts of weighting (its default is 9 cycles). It should work as a substitute for The Wizard, but I do not have one with which to test.
Additionally, Darryl Parker at TFT Inc. has informed me that their Model 844A and 884 monitors have weighting. The feature is called the “Peak Modulation Duration Differentiator” or P.M.D.D.
The 844A has a thumbwheel switch to set a window for peaks to trigger a counter. The window for the counter is adjustable from 0 to 0.9 milliseconds. In the 884, the window for the counter is not adjustable: it is preset at 0.9 milliseconds. On the 844A there is a numeric display of “Peaks/Min” which shows a predicttion of the number of peaks/minute that will make it through the window, based on the time between peaks. The 884 does not have a “Peaks/Min” display; the peak flashers are adjustable, however. I have not played with either of these.
Other monitors may also do weighting, but I do not think they have been promoting that.
FMeXtra With RDS
By the way, if you run – or plan to run – RDS, I have not found it necessary to account for typical levels of 57 kHz RDS injection. That may be because it is narrow and locked in-phase to the pilot.
For example, a pure sine-wave could be inserted at up to 3.6% without increasing the total at all because the third harmonic puts a dip in the top of the 19 kHz waveform. One point here regarding FMeXtra is you get a minimum of 8 kb/s extra if you are not running RDS – and more at higher densities.
————
ADDENDUM:
After the lengthy discussion above, you may be thinking, “So why can’t I just set injection with a spectrum analyzer?” Yes, you can do that, though they tend to be scarce and dear.
The chart below shows the baseband frequencies and occupied bandwidth of all current FMeXtra modes (the rds suffix indicates that the spectrum around 57 kHz is protected). It provides a reference for setting injection when a good quality spectrum analyzer is available and presumes that the 19 kHz pilot is set at 6 approximately 9%. Resolution and video bandwidth settings are very important. Here, 1 kHz is used for both.
By noting the difference between the pilot amplitude and the flat top of the FMeXtra digital signal, the injection can be set with reasonable accuracy. Note that current FCC Rules permit only 10% injection above 75 kHz.
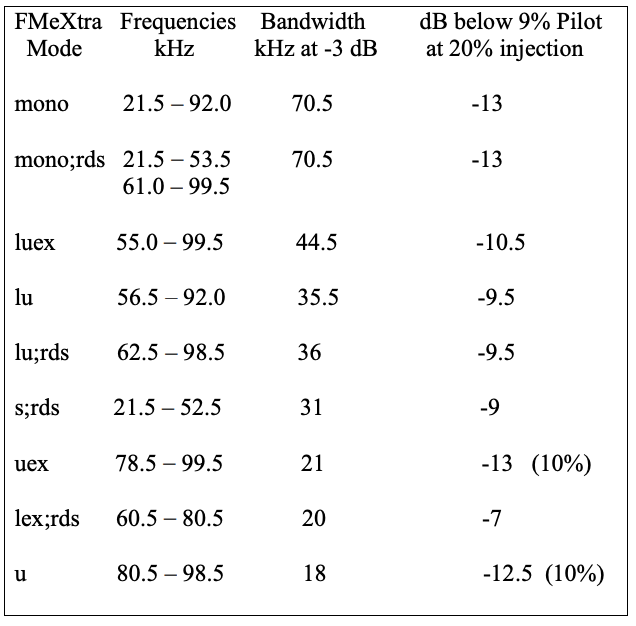
Ignoring rounding, the chart demonstrates that as the occupied bandwidth is increased, the digital signal appears lower; at the same injection, double the bandwidth will appear 3 dB lower, half power.
For example: The commonly used lu;rds mode at 20% injection should appear about 9.5 dB below the 9% pilot; luex about 10.5 dB below the pilot. The former is the mode shown in the baseband spectrogram in the main article above, however that pilot is about 8% and the FMeXtra marker is sitting atop a small peak. Hence that spectrogram shows FMeXtra only about 9 dB below the pilot.
These numbers were derived from an HP ESA-L1500A spectrum analyzer which was set for 1 kHz resolution and video bandwidth looking at 0-100 kHz averaging 200 sweeps. A BEXT LEX-30 stereo exciter was used. The FMeXtra encoder was fed into the exciter’s SCA jack and the 19 kHz pilot was supplied by the internal stereo generator.
Belar FMMA-1 (The Wizard) total modulation, FMSA-1 stereo, and SCMA-1 SCA monitors were used. The Wizard was fed by the IF output of a DC-4 tunable down-converter which then fed the other monitors and spectrum analyzer.
– – –
Lyle Henry, K9DKW/K7OO, is a Los Angeles-based engineer who has consulted on FM and SCA issues all over the world. Contact Lyle at: lylehenry@fastmail.fm