

A Better Way to Determine Your Station’s Field Intensity

[August 2014] In the past few years, broadcasters have benefited from FCC’s Rule changes to simplify design and construction of directional antennas via the Method of Moments (MoM).
One of the hallmarks of MoM is a sharp reduction in the field measurements needed to prove an array. Yet, many stations still take measurements for various reasons. Alan Alsobrook gives some secrets on how to make the task easier.
Although the FCC’s Method of Moments modeling makes installing and proving directional arrays (DA) much easier, there are still plenty of situations where field measurements must be taken. For example:
- Checking monitor points on existing DAs.
- Partial proofs (depending upon the number of radials involved).
- Finding and replacing a bad monitor point.
- Running radials in support of applications or as evidence at hearings.
Sometimes this can become a major project.
I was asked to run radials to support an application that was going to the FCC for one of my clients. This included running one radial that spanned over 350 miles – as far as three states away from the target station.
The big challenge: it was important to do this without it becoming a fulltime task for a month.
Point Hunting
The process of running radials tends to come in two “flavors:” seeking out previously measured points from an old RF Proof or blazing a new path on a previously unexplored radial.
Both of these situations present their own unique challenges that have to be overcome for a positive outcome.
When verifying an old proof it is helpful to plot the radials on a current map and identify where changes have occurred over the years. This will give you a good idea of any areas that may no longer be accessible, as well as areas that may now be available that were not before – should you find that you need some additional points.
On the other hand, when plotting new radials, it is important to know how many readings you will have to take along each radial – the answer will depend upon the purpose of the survey.
Start in Non-Directional Mode
One of the primary reasons to run a radial is to determine the Non-directional (ND) effective field at one kilometer.
Not only does this meet the FCC requirements for a change, but it also gives you a indication of whether your transmitter and antenna are radiating properly – meeting both the minimum radiation efficiency for the class of station, as well as the published radiation in the FCC records.
When you do this at a multi-tower array (DA) you want to make sure your reference location is the tower that is being used as the ND radiator. Otherwise your readings will produce erroneous results.
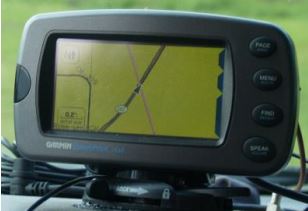
Perhaps the easiest way to ensure accuracy is to take a GPS reading at that tower base. I use a Garmin GPS-V and have had very good results by using the “average location” function, leaving the GPS at the tower base for an hour or two to get a very close latitude/longitude reading.
I would be remiss if I did not point out that at this stage you will want to save any existing data in your GPS off to a computer and flush all user data from it. I will explain why shortly.
Plot, Then Go
Once you have accurately ascertained the base location you can plot your radials.
Depending upon the consultant involved this information may already have been laid out on maps – or you might just get a station call sign and a radial to measure. Actually, with all the new toys we have today I pretty much prefer the latter – as it tends to reduce wasted time at points with significant re-radiation.
If just given the call sign and direction, I like to start by pulling up the station data and look at all the existing information.
Use the Right Data
One aspect that requires a bit of caution concerns the latitude and longitude for the station.
To the best of my knowledge the FCC is still requiring that applications be submitted with NAD 27 datum, and the FCC database normally is in NAD 27. However, this data usually needs to be converted to NAD 83 to work best with current mapping programs and GPS units. To do that I use NADCON, which is available from NOAA at http://www.ngs.noaa.gov/TOOLS/.
NAD 27 and NAD 83
NAD 27 is based on the Clarke spheroid of 1866 and is referenced to the survey “station” at Meades Ranch, Kansas (near 39 13.447 N, 98 32.520 W) which seems to be on a remote hill top about 200 miles west of Kansas City. NAD 83 was developed to correct for some errors that existed in the NAD 27 datum. This was a joint effort with the geodetic agencies in Canada. Depending upon where you are, are there may or may not be a noticeable difference between NAD-83 and NAD-27. There is one location where there is no difference in the two. That is in a lake North of Highway 101 in Canada (47 48.564 N 83 33.560 W), which seems not to be close to anywhere populated.
Since GPS devices use WGS-84 which is, for all practical purposes, the same as NAD 83, it is much easier to do all fieldwork in WGS-84 and then do the conversion for the final application to NAD 27. The most current FCC information released that I have found on which datum set to use is available here.
With the NAD 83 (WGS-84) latitude and longitude data issue in hand, it is time to start mapping. For existing stations I usually start by looking at Google Earth, just to make sure the antenna is really at the specified site. For new stations, a trip to the tower base to “mark the spot” is highly recommended.
Finding the Right Place
One time, when I looked up a station’s coordinates, they seemed to be in the middle of a warehouse parking lot – but no tower was there.
After looking over the satellite pictures, I was able to locate the AM tower about 1000 feet away, apparently not in compliance with the tower registration Rules. This picture clearly shows the error in location.
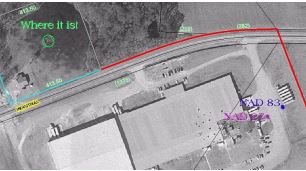
“Where it is!” just was not where the FCC thinks it should have been.
The NAD27 mark on the right side is where the tower should have been according to the FCC. The NAD 83 mark is where the tower should have been after converting the FCC data.
As you can see, I have found Google Earth to be very accurate in locating the right spot for existing stations. This is especially helpful when you have to measure a station for which you have not previously done work.
Once you know exactly where the tower is located, you can start to work with maps the FCC will accept – official FCC submissions require radials to be plotted on 7.5 minute quadrangle maps. DeLorme’s Topo Quads is one program you can use to do that, but you do not need the quads to get started. I use Street Atlas for most of my operations – and only plot to the quads when needed. The nice part about using Topo Quads and Street Atlas is you can easily swap your plot files from one to the other.
I have found the easiest way to lay out radials is to use the draw function of the mapping program, marking the base point first and then telling it to draw a line at desired degrees for the number of kilometers it needs to be run.
Once each radial is drawn on the map, I mark a point exactly at the end of each radial. This end point for each radial is transferred to my GPS program for routing. However, even with a GPS unit on board, I have found it is very helpful to print out some 11×17 maps to carry with you for each radial.
Two GPS’s Are Better Than One
Now we have the information we need to start preparing the GPS field load.
I personally use two GPS units – one that stays in the vehicle for navigation and one portable handheld used to closely locate the actual radial point locations and mark them when measured.
Using the software that came with your GPS, set the base point and the end points of each radial to be measured. Then use the route tool to set a route from each radial end to the base point. This is to give a correct “Distance to Final” that is your base point and not the end of the radial. Make sure that you tell the software to “Not follow Roads.”
A useful tip when plotting the radials is to give each radial an easy name to remember such as “WXXX270,” so you can pull it up easily. After all of the route lines have been set up, you can export a file from the GPS program in a GPX format and use Google Earth to open it. All of your radial lines should display and let you take a look at what sort of obstacles you will be facing when you go out to measure. That does sort of take a bit of the “fun” out of those “discoveries” that always seem to happen when out running radials.
Introducing the FIM-410
(If you happen to be one of the fortunate ones who has one of the new FIM-4100’s just skip the rest of this section.)
To prep for the field readings, I added a couple of accessories to my FIM 410 (Field Intensity Meter).
Since Potomac came out with the FIM-4100, I decided to re-designate my modified FIM-41 as a FIM-410. The modification includes adding a wide adhesive strip of Velcro to the left side of the meter. This is for the placement of a portable GPS and a Voice recorder while I am doing the field measurements.
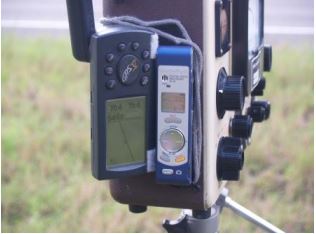
The Alsobrook FIM-410
Now, you may be a bit concerned, thinking that applying these devices may introduce an error into your readings. And you would be correct, at least with the GPS-V.
After extensive testing up and down the dial, I have determined that you can get a higher than proper RF reading with the GPS-V on the side if you are on one of the lower two scales. On the other hand, the voice recorder introduced no error at all.
The quick solution to the GPS-introduced error is to simply pull it off and stick it in your back pocket while taking the reading. As soon as you have your reading in “head” stick the GPS back on to mark your location. I do not think you will need to worry about forgetting to remove the GPS unit on the lower scales as it will introduce a hissing noise on your received signal reminding you that it needs to be moved away.
Getting Ready For the Field
There are just a couple of additional things you should have on hand before taking off to measure a radial, things to help you stay safe.
First get a traffic vest – one of the newer ones in compliance with the new ANSI/ISEA standards for working on federally-funded highways. Not only might it help keep you from being hit by a car, but it also seems to help you “blend in” better while making measurements, so not quite as many people ask “What the *$&^ are you doing?”
Secondly, provided local law allows it, put a yellow rotating light on the roof near the rear of your vehicle. This will also help prevent someone from hitting you or your vehicle. Better yet, with a nice yellow rotator, it looks like you are supposed to be pulled off to the side of the road doing things. This often gets most law enforcement to ignore you, which can be a good thing.
Picking the Right Point
Basically, when selecting a point you do not want to be close to any “large metal objects” – and that includes your vehicle.
Additionally, avoid overhead power lines; the bigger they are the further you need to stay away from them. Be suspicious of any power poles, even wood poles. Indeed, the ground wire running down the side of power poles often is a strong source of re-radiation.
Of course, if you are starving for readings, go right ahead and take a reading at a point that might seem like a poor choice at first. It indeed may be a bad point, but I also have seen points I thought were useless have re-rad levels of less than -25 or -30 dB. Even a point with -10 dB of re-rad may be useful during data reduction.
The lesson here is: use your eyes and try to find a “clean” point. When in doubt, take the reading and note the re-rad as a possible problem. With experience you will get fairly good at guessing where re-rad will or will not be a problem, but to be honest, it is always a guess.
Still, this method can be very useful on some urban partials where useful points are hard to find.
Once you have picked a spot you think will be good as a measurement point, tune the desired station in on the FIM. Then, with the desired station tuned in, it is time to calibrate the FIM and take a reading.
Making Good Measurements
It is not hard to make proper FIM readings – just follow the meter’s instructions carefully.
Usually, they are pasted in the cover.
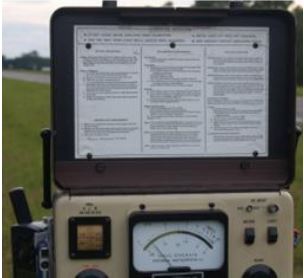
If not, get a copy and paste it there, yourself.
Here is how I make sure the readings from my meter stay accurate.
- Set the “Function” switch to the “Batt” position.
- Make sure you have a reading in the BATT area (approximately 5-7.5 on the scale).
- Check all switch settings, “Ant/Ext” needs to be in the “Ant” position; the “LOG/LIN” switch must have “LIN” showing.
- You should probably ensure the light is off since you do not need it for field readings.
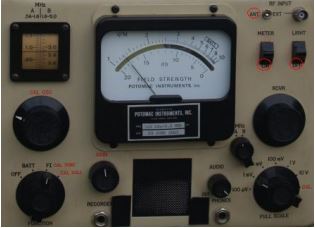
Set the Meter for the internal antenna, LIN mode, and light off
5. Calibrate the meter. With side of the FIM loop antenna pointed directly at the station to be measured, set the function knob to FI.
6. Verify that you have the “RCVR” tuning adjusted to give a peak reading on the meter. This reading should fall somewhere on scale, if not, rotate the “Full Scale” selector to get an on scale reading.
NOTE: Always start with the “Full Scale” selector set for a higher reading than you expect to get or you can damage your meter movement – and trust me, you do not want to know how much it will cost to replace that meter – if you even can do so.
7. With the station now peaked, rotate the “Full Scale” selector to “CAL” and turn the meter away from the tower.
8. Now adjust the “CAL OSC” to give a peak reading, also if a heterodyne is heard you can use the zero beat as the peak reading.
9. Finally switch the “Function” to “CAL NULL” and adjust the “GAIN” for a minimum reading.
10. With this completed, switch back to “FI” and “Full Scale” to give an on-scale reading with the signal peaked, and take the reading. This should be with the antenna aligned towards the radiator of the desired signal – not a re-radiation source.
11. Rotate the meter carefully for a peak indication as well as making slight adjustments to the “RCVR” to verify you have achieved the peak reading.
12. Take your reading, noting the “Full Scale” setting. Keep in mind that the value printed on the “Full Scale” position would be the value if the needle were sitting right on the “10” mark.
13. Record your reading, the time, location, and any other observations or notes that you might find useful in locating the same point in the future.
For a quick example: if you were on the 100 mV scale and the reading was 5.2, then you would record a reading of 52 mV/m. I know this may seem like the easy stuff to some of you but, trust me, there are quite a few of the newer guys that have not been shown how to do this and could really benefit from this step by step procedure.
Double Check the Point
Now I want to strongly recommend you add an additional data reading at each point, something that many people have done for years – yet many others have not even heard about. This step was imprinted in my head by Phil Alexander (I will not say exactly how Phil imprinted that into my skull, but I did notice his walking cane had few new dents in it afterwards) while we were teaching the AM RF classes.
The procedure is, once you have your signal strength reading, rotate the meter looking for the minima in signal (hopefully you will have to switch down at least one scale), and record the reading in dB down from the carrier. (The dB scale is the lower scale on the meter, and has 20 divisions per meter scale.)
Optimally, you are looking for a minima at least 20 dB below your on-axis signal. In other words, the reading should be at least one scale down and equal to or less than the numeric value of your field strength reading. This will assist in proving that the point is good.
If you do not get a reading that is 20 dB down, go ahead and record the reading anyway, keeping in mind that this may be a reading that is “thrown out” later in the analysis process.
Double Check the Meters
If more than one meter is to be used for radial measurements, then bring all the meters to be used together.
This way, the readings can be compared, to make sure they are all in close agreement.
To do this you should check the station you will be measuring with all meters at the exact same point – perhaps the same tripod – along with a few additional signals near the same frequency, but some distance away, to allow you to compare readings on multiple scales.
How Many Points and Where?
If it falls upon you to establish the points, it might be helpful to know how many points you need to take and how far out to go.
The minimum number of readings per radial usually is 15, but you should take more points in case any readings need to be thrown out.
Start by determining how close you can get to the antenna to take your closest measurement. For the Non-DA readings, this is either five times the height or one wavelength. For a DA array you need to be out at least ten times the spacing between the towers.
The recommended spacing for measurements between the closest point and 3 km is 0.2 km, with at least seven readings required. Again, more is better. If you have to, you can space your readings closer together to get the seven required. In some cases here in Florida where underbrush is impenetrable and alligators really do hang out in swamps, I have had a few where I have had to make readings within 100 feet of each other.
From 3 km to 5 km, the recommended spacing is 1 km. From 5 km to 15 km, the spacing is 2 km. If for any reason you are unable to make your minimum requirement in any segment, take as many readings as you can, as soon as you can, along the radial until you have about 25 to 30 readings.
When doing a longer radial in support of an application, there is no specific Rule to follow after 15 km, but a reading every 3 to 5 km generally works well.
By the way, it is a good idea to check with the consultant involved and see what needs to be proved, such as a specific contour. When you know what you are looking for, you can tighten up your readings a bit in the area of concern. Then loosen up again until the end of the radial.
Time-Saving Tricks
At this point I would like to share a few tricks I use in the field to make the readings go a bit faster.
First, as noted before, I use two GPS units – a Garmin Street Pilot 2610 for navigation and a Garmin GPS-V for actual point location and marking.
Both GPS’s are loaded with the radial route data, and as I measure each radial, I activate the route for that radial on both of the GPS units. This shows exactly where the route crosses the radial.
Using the GPS in the car allows me to navigate to the next measurement location easily. Many engineers do this with a laptop connected to a GPS, as I have in the past – but that creates some additional safety concerns looking away from the road to laptop.
When I have safely stopped near a point, it is time to get out and find the right spot. I look at the route line on the GPS mounted to the FIM-410 to locate the spot. Standing on the spot and noting the direction to the source for the station I am measuring, I take a quick look at the signal strength both on-axis as well as 90 off-axis to the source.
If the point looks good, (a nice peak towards the station and a good dip off-axis) I verify calibration and take my readings.
A note about some GPS units: One problem I have observed is the route line on the map screen will vanish from time to time – and may not be able to be brought up at all – if first activated close to the destination.
I did call and asked Garmin about this. I thought I had called one of the transmitter manufacturers; their response was: “We’ve never heard of that before.” Perhaps if enough others ask about this, they might investigate the problem and update the firmware to correct it.
Meanwhile, to overcome this, I have found that you can do the following:
- Activate the route a distance away from the destination.
- If (when) the route line vanishes from the screen, zoom out about ten times until you see it return then zoom back in and it will remain.
- If you are near the end of a radial, you can get on the route line and start a new route from that location to the destination way-point; the route line will stay on the screen.
Documenting Data at the Point
Working alone, I have found it takes quite a bit more time to record the data from a point on paper than using a voice recorder.
Solution: after taking readings at a point, and keeping them in memory for just a moment, I turn to the side of my FIM-410 and switch the GPS from map screen to the data screen, activate the voice recorder and record my readings.
I do this in a very specific sequence so that I can make sure that I do not miss anything. I also call off each reading twice.
The sequence I use goes like this: XXX mV/M over YY dB XXX mV/m over YY db, (pause) at ZZZ.ZZ km, ZZZ.ZZ km, (pause) bearing WWW Degrees, bearing WWW Degrees, at latitude DD/MM/SS, DD/MM/SS, (pause) longitude DDD/MM/SS, DDD/MM/SS, (pause) time HH:MM, time HH:MM, date MM/DD, date MM/DD. This is followed by the point description, then any notes about the point.
The notes should include anything unusual about the point or readings as well as any changes in the weather or other conditions that might affect the data.
I then stop the recorder and mark the location on the GPS.
Moving Data to the Computer
Of course there is a downside to the method: you have to spend about 30 minutes at the end of the day to type in the day’s readings.
To speed things along, I have an Excel spreadsheet set up to transcribe the data in the exact same order. When you have everything timed correctly, you should be able to hit the play button on the recorder and type in each section of data without having to stop and rewind the recorder.
It seems to me this method saves about three minutes at each point when working alone. I just set the recorder to the right of my keyboard and tap the play button with my little finger and start typing.
If you have not tried this before, you will probably want to practice a few times so that you feel comfortable with it. As you practice entering the data, you will quickly determine how long you want your pauses – and why you want to say everything twice.
Save the Raw Data
At the end of each day, you should pull and save the track and waypoint data from your GPS. You also should download the audio from the recorder and save it.
Then, if any questions should arise later about any of the data, each of your waypoints in the GPS will be time-stamped, as will each audio clip from the voice recorder. Your track log will show exactly where you traveled and at what time, providing plenty of information to fall back upon to clear any confusion.
When you are all done with the measurements for a particular project, you can take all the saved files and stick them someplace safe for future reference should it ever be needed.
And now you know the secrets for making accurate and reliable field measurements in an efficient manner.
– – –
Alan Alsobrook is a contract engineer based in St. Augustine, FL. He has traveled many miles in the pursuit of good field readings, evidenced by the pile of Diet Mountain Dew cans in his SUV. Contact Alan at: radiotech@bellsouth.net