
Measuring RF Power – Getting it Right

[February 2025] The measurement of RF power has gotten more complicated with the introduction of complex digital waveforms and multi-carrier formats. To get an accurate measurement of RF power is a challenge, requiring an understanding of the both traditional and newer, improved techniques of power measurement.
The Diode Detector
For decades the average responding diode detector has been the mainstay of FM broadcast and TV aural power measurement. Diode detectors offer a simple, inexpensive means to measure CW (continuous wave) and relatively narrow-band type signals where an average of the RF sample is produced.
The diode detector system consists of a pickup loop, diode, and smoothing network usually consisting of a resistor and capacitor.
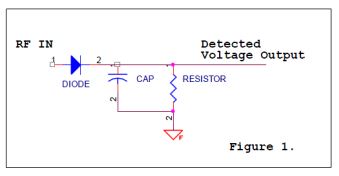
The detected output voltage which is an average of the RF sample is fed either directly to a meter movement or conditioned before being fed to an analog or digital display. The diode detection method shown above will work well for CW-type signals and fairly narrow-band signals with low crest factors.
Peak Values
Now let us look at the case of peak measurements. For example, consider two equal amplitude RF carriers separated by 1 MHz. The diode detector output provides a DC component average of the two signals. The average power in this case is equal to the sum of the power of each carrier. The peak power would be 3 dB higher than this – giving a peak to average ratio of 3 dB and a crest factor of 2.
Restriction in bandwidth of the measurement system will not affect the average power but can have an effect on peak power measurement. If the bandwidth were restricted to just 1 MHz, the resultant carrier would be attenuated by half or 3 dB. In this case a 1.24 dB error will result in peak power measurement.
Also keep in mind that a diode is a non-linear device by definition of its transfer function, and when used in a power measurement system they operate in the non-linear portion of their dynamic range. If a multi-carrier set of signals (such as those in the broad band line of a combiner system) are presented to a diode detector, errors are created due to the non-linear mixer effect inherent in diode action. This makes the diode detector unsuitable for multi-carrier systems.
Thermal Bridge Detection
There have been several different types of thermal detectors used for RF power measurement over the years. These types include electromechanical thermocouples and thermister types.
A newer style of thermal detector is the thermal bridge detector. There has been a lot written about the legacy style thermal detectors so the discussion will be limited to a brief description of thermal bridge detection methods.
Thermal bridge detectors are typically used to overcome the problems associated with measuring power of complex modulated and multi-carrier systems. The advantage of the thermal detector is that it is inherently more broadband than the diode detector. Bandwidth is generally limited by the associated directional coupler.
The thermal detector is a linear detector which responds to the heating effect of the RF signal(s) applied making it more suitable for measurement of multi-carrier signals found in television systems, combined FM systems or multi-carrier digital systems such as CDMA and COFDM modulation techniques.
The thermal detector is comprised of a balanced resistive bridge where the resistive element changes resistive value with temperature change. This element is coupled by use of an RF directional coupler to the RF signal. Heating by the applied RF signal causes the bridge output to change in accordance with the applied signal level. The resultant voltage output of the bridge will vary linearly with the level of RF presented to the bridge. The resultant DC voltage is fed to a voltage amplifier such as a differential operational amplifier and fed either to a meter movement or analog to digital converter for electronic display. Figure 2 presents a simplified schematic.
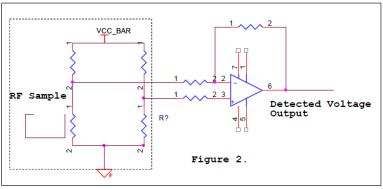
The components enclosed by the dotted line are within an isothermal barrier, which is required for such type detectors to work correctly and not be influenced by external temperature variations. While this system can work well under controlled conditions such as fairly constant ambient temperature it is difficult to make these systems completely independent of temperature changes. Another limitation of thermal bridge detectors is its dynamic range. The typical thermal detector has a 20 dB dynamic range, which is better than diode detection.
There also other mechanical challenges to building a thermal detection system. Care must be taken in the design of the directional coupler such that all of the energy from the take-off port makes its way to the detector. In addition, the detector must be built in an isothermal chamber to minimize changes in the ambient temperature from affecting accuracy. These factors add to cost and complexity.
RMS Detection Methods
The newest class of RF power detectors uses RMS to log techniques, ushering in a new generation of active component detection systems.
This new class of detectors has several advantages over their predecessors. These advantages include wide bandwidth, modulation and crest factor independence, increased dynamic range and temperature compensation for better linearity. Figure 3 illustrates the following discussion.
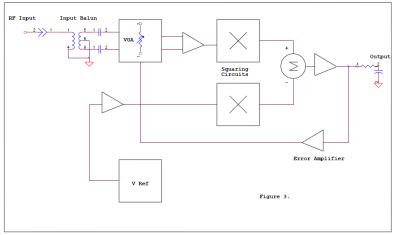
The RF input is taken from a calibrated directional coupler and fed to a balun transformer so that the impedance looking back to the input is maintained at 50 ohms. The signal is then fed to a “linear in dB” variable gain amplifier whose gain is controlled by the output signal. Linear in dB refers to the output voltage being a specified amount per dB of power measurement, for example: 50 mV/dB.
The output of the VGA is then fed to a low range RMS to DC converter whose output signal is equivalent to the RMS output of the VGA amplifier. A fixed reference is derived and compared to the output of the RMS to DC converter and an error signal is derived. The output of the error amplifier is applied to the VGA to control its input. This works very much like the AGC amplifier in a conventional super heterodyne receiver in that the voltage gain is negative for increasing input signal.
This “AGC” allows the system to have a higher dynamic range than previously discussed measurement techniques. Because the VGA gain is linear in dB the slope of the correction voltage is a straight line comprising a -50 mV/dB slope. The RMS to DC converter uses a squaring cell which produces a DC representation of the input, along with higher order components which need to be filtered out. For pure sinusoidal input the output will consist of a DC component and a sine wave of double the input frequency according to the trigonometric identity: Cos²Ωt = ½[1+Cos (2 Ωt)]
The squaring function is at left, the 1 is the DC component and the cosine function is twice the input frequency of Ω = 2Πf. Filtering can remove this 2nd order tone for single frequency systems.
For more broadband signals such as the In-Band-On-Channel digital radio system which is a COFDM (Coded Orthogonal Frequency Domain Multiplex) technique, 8-VSB (8 Vestigial Side Band) and cellular CDMA (Code Division Multiplex Access), the output of the RMS to DC converter will contain components from DC to approximately half the original band width. Even with second order filtering the error signal will contain ripple riding on the DC component.
Additional filtering is performed to produce a clean output to the VGA. In practice, this technique allows precise measurements with a dynamic range approaching 50 dB. To illustrate the measurement range capability consider the following example:
RF carrier power = 10 kW
A half power measurement of 3 dB is 5 kW
At 40 dB down the system can still resolve a 1 Watt output
In the case of an IBOC carrier added to the analog carrier above the total would be 10,100 Watts. The RMS system described above can still resolve 100 Watts with the analog carrier removed. Practical measurement systems using this technique are capable of 2 to 5% of full scale resolution.
Interestingly, this is not a whole lot better than DC diode detection methods for analog FM. There is, however, improvement in the ability to measure multiple carriers accurately and the increased dynamic range. Diode detection and thermal methods suffer poorer performance, the former in both, the latter in dynamic range.
Unlike diode and thermal detectors, RMS detectors are generally capable of withstanding input signals which are as much as 10 dB greater than the high end of their linear range. This allows the detector’s entire linear range to be used while providing a generous tolerance for overload conditions. Active temperature compensation is also a feature of this new class of detectors. Temperature compensation allows for better stability in harsh environmental conditions.
Pickup and Display
The picture of accurate power measurement would not be complete without a discussion of the pickup device and the display device.
The dual-port directional coupler can be used to extract a calibrated fraction of the actual signal and be fed to the input of an RMS sensor. The specifications for the directional coupler are an important factor for overall accuracy of forward and reflected power measurements. One key specification for good accuracy is the measured coupler loss. That is, the attenuation factor that the coupler is designed to provide.
A typical example would be to use 60 dB of coupling loss. The value can be anything desired, but it must be known with some degree of certainty as it is the representation of the signal being measured. This value should be within 0.1 dB to keep overall measurement error to just about 2 % of expected full scale value. The 60 dB value is chosen as a compromise between how much attenuation will be needed before it can be fed to an RMS detector and how much loss can be tolerated before the directivity of the coupler is affected.
There is a tradeoff between coupler loss and directivity which, by the way, is another important specification. Directivity becomes important as to the absolute resolution of the measurements taken from the coupler and will suffer if too much coupling loss is designed into the system.. A good Rule of Thumb is that you will need to have at least 10 dB or better directivity than the return loss that you are attempting to measure.
As an example let us choose 35 dB of directivity as a design goal. 35 dB works out to be equivalent to a VSWR of 1.04/1. The real resolution with uncertainty factored in would be a return loss of 10 dB worse or 25 dB. This makes the actual resolution of VSWR limited to 1.12/1 with little uncertainty. While it is possible to resolve higher return losses than 25 dB with this directivity value, uncertainty increases.
Coupler port termination is also important for accurate data capture. A balanced coupler with forward and reflected ports needs both ports terminated with their characteristic impedance in order to take advantage of the maximum directivity that the coupler is designed for. High VSWR in the lines between the coupler and the detector will affect overall accuracy. The VSWR, coupler port impedance, cabling and detector impedance all need to be matched. The VSWR between the coupler and sensor must be at least as good as the coupler directivity otherwise resolution will be reduced.
A final word about directional couplers deals with the physical construction of said coupler. A precision coupler will have its pick up loops and center conductor fixed in place upon calibration. This insures that the coupler loss measured at time of calibration can be guaranteed at time of installation.

The next element of the measurement system is the RMS detector which we have already been discussed in length. The amplified output of the coupler is then fed to some sort of display for observation. Analog meters have their place in power measurement and have their limitations, but they will not be addressed here as much of the measurement of anything these days is being displayed and stored in digital fashion. Therefore, the discussion of analog to digital conversion is appropriate.
Analog to digital converters are generally specified by the number of bits they can resolve. The stability of the A/D reference is also important for good results. A 10-bit converter will allow 1024 discrete steps of resolution. The dynamic range of this converter is calculated as:
DNR = 20 LOG 1024 = 60.2 dB
If we measure a 10 kW output using a detector with a linear output, this means that each discrete step that the converter can theoretically resolve is less than 10 Watts:
10,000 Watts / 1024 = 9.74 Watts / step
For a sensor with a 50 dB dynamic range a 10-bit converter is adequate for accurate display over the range of the sensor. RMS detectors which produce a logarithmic measurement paired with higher resolu-tion converters offer significant advantages in both dynamic range and resolution for more demanding applications.
Summary
While it is quite acceptable to use any of the methods described for power measurement – with certain limitations – there are specific cases where one method over another may be advantageous. For single carrier low crest factor signals such as conventional FM, diode techniques may suffice if a limited measurement range is acceptable. For more complex signals such as CDMA, COFDM, and 8-VSB RMS detection techniques offer better accuracy over wider bandwidth.
RMS techniques do not suffer from the dynamic range and environmental limitations of other methods, providing a higher degree of accuracy, repeatability and reliability. Hence, a careful choice of components such as directional couplers, sensors and display technology will result in higher degrees of accuracy and repeatable results.
– – –
Bob Tarsio is President of Broadcast Devices, Inc., in Courtland Manor, NY. His email address is Bob@Broadcast-Devices.com
– – –
References:
Analog Devices, Inc Application Note AN-653 Improving Temperature, Stability, and Linearity of High Dynamic Range RMS RF Power Detectors – Eamon Nash
Microwaves and RF October 2000 – Measuring Power Levels in Modern Communications Systems – Alan B. Anderson
RF Power Measurement Techniques for Digital Broadcast Systems, Bird Electronic Corp. – Tim Holt
Narda Technical Note – Power Meters and Monitors – L3 Communications
The author would also like to thank Ron Kumetz of Broadcast Devices, Inc. and Dean Casciola of
Electronics Research, Inc. with assistance in preparation of the manuscript.
Would you like to know when more articles like this are published? It will take only 30 seconds to
click here and add your name to our secure one-time-a-week Newsletter list.
Your address is never given out to anyone.