

Measuring AM Modulation

[September 2020] The modulation depth of an AM station is more than a measurement of loudness. As has been known for many years, overmodulation in the negative direction results in “splatter” up and down the dial. And excessive asymmetry introduces audio distortion. Hence it is important to know what your station is doing. Alan Alsobrook explains.
In a fit of deregulation some years ago, the FCC made modulation monitors “optional.” Many stations jumped on that option and stopped calibrating – or even owning – modulation monitors. However, the requirement to stay within limits was retained. Therefore, it is important for the station engineer to be able to answer the question: “How can a station “prove” they are compliant with the Rules?”
Furthermore, in some recent conversations, the question has come up asking how a station with an old modulation monitor – or none at all – can accurately determine compliance with the FCC’s AM modulation limits.
73.1570(b)(1)
First, we should take look at the Rules and define what your AM modulation limits are according to Section 73.1570(b)(1). We will not worry too much about the minimum (85% on frequent peaks), as most stations today have no trouble maintaining minimum levels.
The text of Section 73.1570(b)(1) reads as follows: “AM stations. In no case shall the amplitude modulation of the carrier wave exceed 100% on negative peaks of frequent recurrence, or 125% on positive peaks at any time.”
There is one slight problem with that rule as I read it: I have never been able to figure out exactly how to exceed 100% on the negative peaks for AM. What they really mean to say is “do not hit -100% very often, preferably not at all.” The reason you want to avoid it is that -100% is defined as “carrier cutoff” – where your carrier actually is completely gone. When this happens, you end up creating splatter.
Monitoring Levels
The easiest way to demonstrate compliance is to go look at your properly calibrated modulation monitor at the transmitter, and note the peak indications and when the lights are flashing. If you can do that, you have the first line defense should the FCC Inspector come calling.
With newer processing equipment it is pretty easy to set up AM modulation so that you get the best coverage while remaining legal.
My personal preference is to set up AM’s to run at about 96% negative and 122% positive on the peaks. This provides a small – and inaudible – margin of protection in case of a monitor calibration error or transient problem.
![]()
An Inovonics AM modulation monitor
Loudness does count with AM. Unlike with FM, station coverage is affected by the level of modulation. (Pumping up modulation to get “louder” on FM does little, if anything, to improve coverage, while it does promote listener fatigue and generally icky-sounding audio.)
When There is No Mod Monitor
If you find yourself at an AM station without a modulation monitor, you still can determine how much modulation you are running.
Many of the current transmitter models include metering, either on the front panel or via software, to read the modulation level. Calibrated by the manufacturer, these usually can be quite accurate.
However, perhaps the most common and easily utilized method – and the most accurate – is to employ an oscilloscope and some test leads.
Using the Oscilloscope
The first thing you want to check is the negative modulation depth.
The easiest way to do this to connect the modulation monitor sample port on the transmitter to your oscilloscope and adjust the scope gain such that the unmodulated wave form is set to consume approximately 3/4 of the screen above and below the center line. Once set up and operating, any time you see any flat lines on the zero line, it is indicating excessive negative modulation.
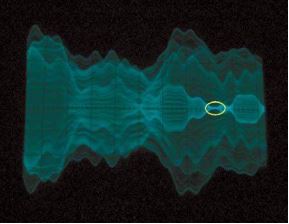
At -100% modulation, carrier cutoff occurs
as shown in the ellipse above
While processors may be set to “clip,” leaving a small flat region above the zero line, this is not a problem (other than distortion).
What you do not want to see is when the two halves of the waveform meet in the middle as a flat line – as seen above – even for a moment. This indicates 100% negative modulation.
Depending upon your transmitter, antenna system, and frequency of occurrence, the spatter that is caused can become rather obnoxious.
This problem is one of the reasons the old Magnavox AM Stereo system failed: when the carrier started to disappear, the audio got very “nasty.” However, in some ways this actually was less a transmitter issue than that of some consumer radios, which do not handle the upper regions of negative modulation well, introducing significant distortion above -92 or -94% modulation – even emulating a loss of carrier at these high negative modulation levels.
On the Positive Side
Once a transmitter has been set for the proper modulation depth to prevent -100% (carrier cut-off) and any resultant splatter, it is time to observe the positive peaks.
In contrast to the limit of 100% for negative peak modulation (a limit you really do not want to reach, as it is carrier cut-off), the FCC Rules at Section 73.1570 (b)(1) allow positive modulation peaks up to an absolute limit of 125% This takes advantage of the natural asymmetry in the human voice along with the finest unnatural asymmetry controls available on most any processor produced in the last 30+ years.
Looking at the Scope
Again, we will use an oscilloscope to look at a sample of the transmitter’s RF output.
To an extent, measuring positive modulation using an oscilloscope is the reverse of looking for the negative – instead of looking for the carrier “pinch-off” at the center line, we are looking for the excursions towards the edges of the scope screen.
In order to calibrate the scope for 125% peak modulation – assuming the normal eight-vertical division scope – start by adjusting the scope gain such that the unmodulated wave form is 1.6 graticules above and below the center line.
Once this is set up each graticule will represent 31.25% modulation, each small hash representing 6.25%, and the top and bottom lines will indicate 125% positive.
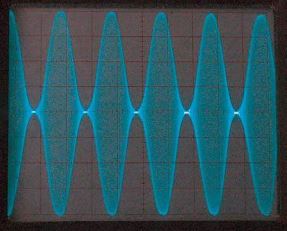
An oscilloscope, calibrated for 125% positive
modulation, shows a transmitter running at the limits
The optimum condition is when the modulation peaks just kiss the top and bottom lines without going over and you do not see any bright spots at the centerline.
To clarify one item that is often confused: the downward going waveform beyond 1.6 graticules below the centerline is also positive modulation. In this configuration, negative modulation is shown only in the area between 1.6 grads above and below the centerline.
Higher Resolution
Alternatively, if you would like to gain a higher degree of resolution, you can set the “zero line” 3.2 graticules below the center line, by grounding the input lead and then adjust the channel gain to bring the top of the unmodulated carrier up to the center line.
This now displays only the upper half of the waveform (each graticule now represents 15.6% modulation and each hash mark between graticules a little over 3%), but it allows for a closer look at the peaks with a bit better resolution.
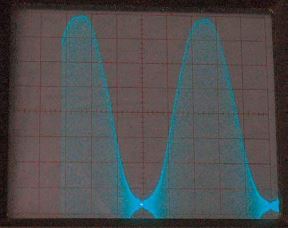
The upper half of the waveform
If you have calibrated the oscilloscope correctly, the top line shown on the screen is effectively 125% positive modulation. You do not want to see any excursions go above the top line.
The difficulties of determining the modulation using this method is that depending on how the triggering is set on the scope you may not see the shots with the highest peaks. I have noticed on the newer LCD scopes that it is often very difficult to get the scope to trigger where it is easy to see the uppermost excursions.
An Alternate Method
A second method of measuring modulation with an oscilloscope, often referred to as the trapezoidal method, can provide easier interpretation of the modulation levels.
For this method, you will need a scope that has an XY option, normally a dual-trace or better. This measurement uses the same set up as before, but with an added input and utilizing the X-Y mode of your scope. The added input will be sample of the audio input to the transmitter.
This sample has to be after the processor and is typically picked off the processor outputs or the transmitter input. The tricky part of this is that you cannot just hook up your scope to that audio line since the input to the scope is unbalanced and the audio line should be balanced. Connecting the scope directly would ground the audio line and knock the audio level down greatly, not to mention the hums and buzzes that might show up.
Looking at the Trapezoid
What you need to hook this up is some sort of isolation. I use a 10k Ohm – 10k Ohm, 15 kHz rated transformer to do this. Using a high-Z transformer such as a Triad SP-66 allows a sample to be picked off the audio line with only a very slight amount of loading that is negligible in most situations.
A distribution amplifier may also be used. Just ensure it is at exactly unity gain and that the phasing is correct. Some even have said that the audio sample point should be from the output of the transmitters’ modulator section, I think that is getting just a bit overly-zealous, not to mention quite dangerous.
Connect the audio lead to the X-axis of the scope, and the RF lead to the Y-axis. Once this is hooked up with no modulation, you should have a single vertical bar. Like before, set the Y-axis gain to give you the proper amount of vertical deflection without modulation (e.g. 1.6 graticules above and below the center line).
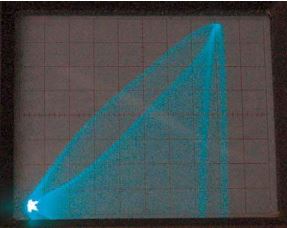
As you add modulation the scope display opens up to a trapezoid that looks much like a left arrow.
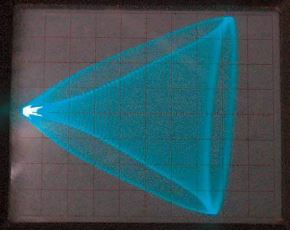
In trapezoidal mode, positive modulation peaks
are shown on the vertical axis, while negative
mod drives the trapezoid to a point on the left.
The X-axis (audio) channel gain can be adjusted to give the best display and is not critical other than keeping the display within the edges of the screen. I prefer to adjust to a point that it just fills the screen.
Once again, the results you are looking for are no excursions above the top line on positive modulation. For the negative modulation you are looking that there is no flat line sticking out to the left from the point of the waveform.
Interestingly, some of the engineers with whom I have spoken are more familiar with the axis of the pattern being rotated; if you prefer that type of display then simply swap the X-Y inputs and reverse the instructions.
Looking only at the top half of the waveform,
125% is shown at the top-right, negative mod
is again driving to a point on the lower left
In the pictures we have presented, you will notice what appears to be a Lissajous pattern. This is caused by a small amount of RF getting into the audio sample. As you can tell, it takes some effort to get this test setup working, although the result is a very accurate display of your modulation peaks.
Of course, as mentioned earlier, the best, easiest, and most accurate way to measure AM modulation is to have a calibrated monitor fed directly from the transmitter. One of the current digital models like the Model 525N from Inovonics definitely will prove compliance with the FCC Rules.
Despite the relaxing of the Rules in recent years, a working modulation monitor really should not be considered an option, but rather an important piece of test gear for any station. Having been fooled a few times, I find I do not trust the oscilloscope method as much as I used to. It still is a valid and accurate method of determining modulation but you have to be very careful when setting it up and interpreting the results.
– – –
Alan Alsobrook, is a contract engineer, based in St. Augustine, FL. Email Alan at:
aalso@bellsouth.net